
02/10Applications new
FreeBSD Jails Panel
Web panel and Rust daemon for monitoring a FreeBSD server and controlling its jails.
Idea
I manage a number of FreeBSD servers where every service runs in its own jail: web applications, databases, mail, DNS, VPN and more. Isolated, easy to move between machines, and a lot of moving parts to keep an eye on.
For years I handled them over SSH with ezjail and a small menu I wrote in dialog(1). It worked, but checking whether everything was up meant logging in, and restarting a stuck service from a phone was out of the question. I wanted one page that shows the health of a server and lets me start, stop or restart a jail with one click, without opening a shell to the internet to do it.
Technology stack
08 Rust
 FreeBSD
 nginx
 React
 TypeScript
 Vite
 Sass
 Motion
The panel has two parts. jailctld is a small daemon written in Rust that talks to the system, and a React 19 + TypeScript front-end (Vite, SCSS modules, Framer Motion) that renders it. The daemon is deliberately boring: a synchronous HTTP server on tiny_http with a handful of fixed endpoints, serde for JSON and Argon2 for the password, and no async runtime, so there is very little code to read and trust.
Security first
A web page that can stop services on a production server has to be careful about what it is allowed to do:
- the daemon runs as its own unprivileged user and is reachable only through nginx, never directly,
- privileged commands (ezjail-admin, rctl, du) go through doas, and the daemon itself generates the doas.conf rules: one line per jail and per action, with the exact arguments, so even a compromised daemon cannot run anything else as root,
- the admin password is stored as an Argon2 hash, repeated failed logins lock the source address out for a while,
- every action is written to an audit log with the source IP, the jail and the outcome,
- without logging in, the page is read-only: health, load and the list of jails, no buttons.
Live metrics
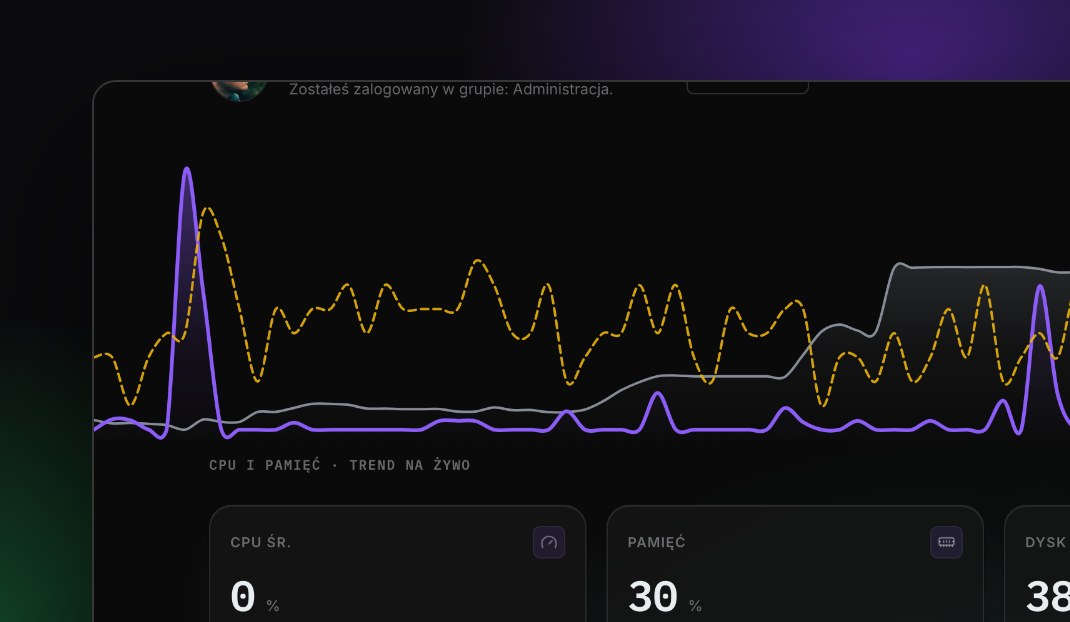
The daemon samples CPU per core, memory and CPU temperature every three seconds in the background, whether or not anyone has the page open, and keeps the last five minutes in a ring buffer. So the trend chart at the top is full the moment you open the page, instead of starting from an empty line.
Below it: load average, uptime, response time, per-core sparklines, physical memory and swap, and usage of every mounted disk, so the question "is the server OK?" is answered before you scroll.
Jails
Each jail is a card with its description, address, and current CPU and RAM usage read from rctl(8). Disk usage is expensive to compute with du on big jails, so it is calculated on demand, cached on disk and shown with its age ("14 days ago") next to a refresh button.
Running and stopped jails are listed separately, can be searched by name and sorted by CPU, RAM or disk. Descriptions are editable in place, and start, stop and restart show their progress on the card until ezjail reports back.
Light and dark
The panel follows the system theme and can be switched by hand. Both versions share the same tokens: